ISSN 2658–5782
DOI 10.21662
DOI 10.21662
Electronic Scientific Journal
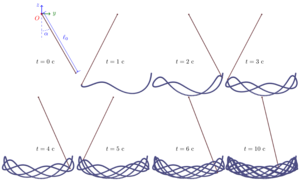
The paper presents an overview of modern free tools for dynamic visualization and gives recommendations for choosing tools depending on the research method, the form of presentation of the initial data, and the specifics of the phenomenon under study. For the convenience of using the materials of the work, the source codes are given both for the programs of computational experiments of classical problems, and for creating a graphical visualization of the simulation results. To animate the process described by analytical formulas, it is proposed to use the gif terminal of the gnuplot program or the Python visualization library. An example of applying this approach to solving the modified Verhulst-Pearl equation, which describes the change in the population under periodic external influence, is given. When studying non-stationary phenomena distributed in space, the results can be presented in video format. The problem of natural convection in a horizontal layer of fluid or gas was simulated in the program FreeFem++ for solving differential equations by the finite element method with the conversion of the results using the GhostScript and MEncoder programs into a video format. An example of using the finite difference method in modeling self-oscillating chemical reactions in the Qt environment with saving animation frames as graphic files is given. To display the results of modeling three-dimensional dynamic processes, it is proposed to use the Blender computer graphics program. Modeling and visualization of oscillations of an elastic pendulum using the built-in Blender Python API interpreter are presented. An approach is shown for dividing a computational experiment and visualizing its results, which makes it possible to increase the efficiency of the use of computational resources. A universal Python-script is proposed for constructing three-dimensional object motion trajectories based on external source data.
free software,
Gnuplot,
Matplotlib,
FreeFem++,
Qt,
MEncoder,
Blender
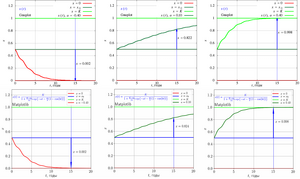
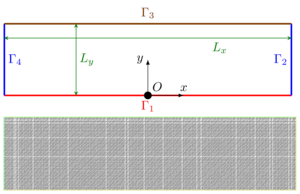
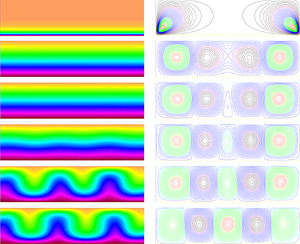
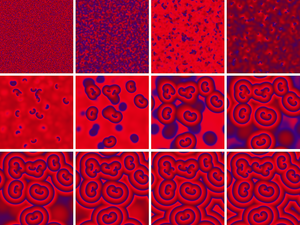
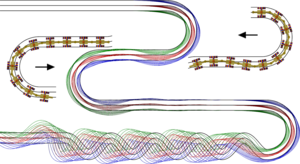
The paper presents an overview of modern free tools for dynamic visualization and gives recommendations for choosing tools depending on the research method, the form of presentation of the initial data, and the specifics of the phenomenon under study. For the convenience of using the materials of the work, the source codes are given both for the programs of computational experiments of classical problems, and for creating a graphical display of the simulation results. To animate the process described by analytical formulas, it is proposed to use the gif terminal of the gnuplot program or the Python visualization library. An example of applying this approach to solving the modified Verhulst-Pearl equation, which describes the change in the population under periodic external influence, is given. For the considered task, the functionality of the Gnuplot script was compared with the scripts from the Matplotlib Python visualization library. To dynamically animate data derived from analytic dependencies or text data files, Gnuplot uses computational resources more efficiently with comparable visualization quality. For animation of more complex datasets (numerical results, databases of experiments), the Matplotlib library or other Python visualization libraries have an advantage, since the basic capabilities of these libraries are greatly extended by the functionality of the Python programming language (for example, using numerical and scientific modules). An important feature of these libraries is the ability to embed them in other applications. When studying non-stationary phenomena distributed in space, the results can be presented in video format. The problem of natural convection in a horizontal layer of liquid or gas was simulated in the program for solving differential equations by the FreeFem++ finite element method with the conversion of the results using the GhostScript and MEncoder programs into a video format. An example of using the finite difference method in modeling self-oscillatory chemical reactions in the Qt environment is given with the simulation results displayed in the graphics window and animation frames saved as graphic files. To display the results of modeling three-dimensional dynamic processes, it is proposed to use the Blender computer graphics program. Modeling and visualization of oscillations of an elastic weightless pendulum using the built-in Blender Python API interpreter are presented. When modeling a dynamic process, you can increase the efficiency of using computational and time resources by separating the computational stage and the stage of processing and visualizing the simulation results. An example of a separate implementation of a computational experiment is given on the example of modeling the trajectory of movement of the modules of a wheeled robot. The simulation was carried out by a program written in the C++ programming language, followed by visualization in the Blender program. A universal Python script for visualizing three-dimensional trajectories is proposed, which can be used not only in studying the features of the kinematics of a robot, but also in other studies (three-dimensional fluid or gas flows, viscous-plastic deformations of a body, heat transfer process, molecular dynamics, motion of celestial bodies and etc.). Note that Blender allows you to save animation as graphic files and in video format. There are two modes (Render menu): Render Animation (save animation, in camera view, slow mode) and OpenGL Render (image as it is displayed in the program window, fast mode).